Sample Measurements, Histograms, and Probability Distributions:
When we make a measurement, we expect to get the true value. This is known as the expected value E(x), or the population (true) mean μ. We rarely get this value, however, as there is always some degree of random error or fluctuation in the system. The result we get will probably not be the true value, but somewhere close to it. If we repeat the measurements enough times, we expect that the average will be close to the true value, with the actual results spread around it.
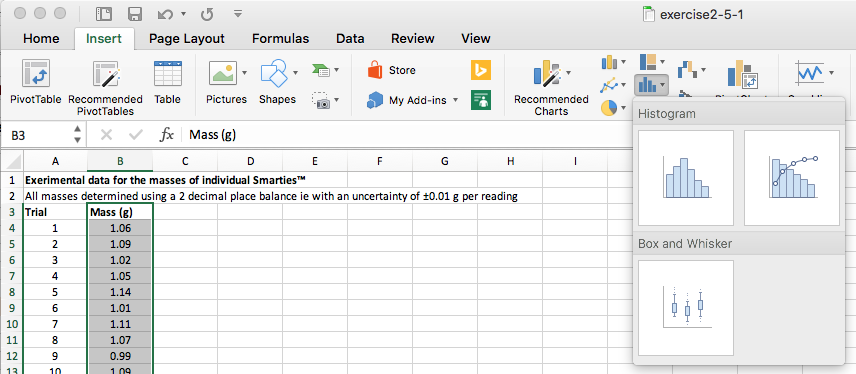
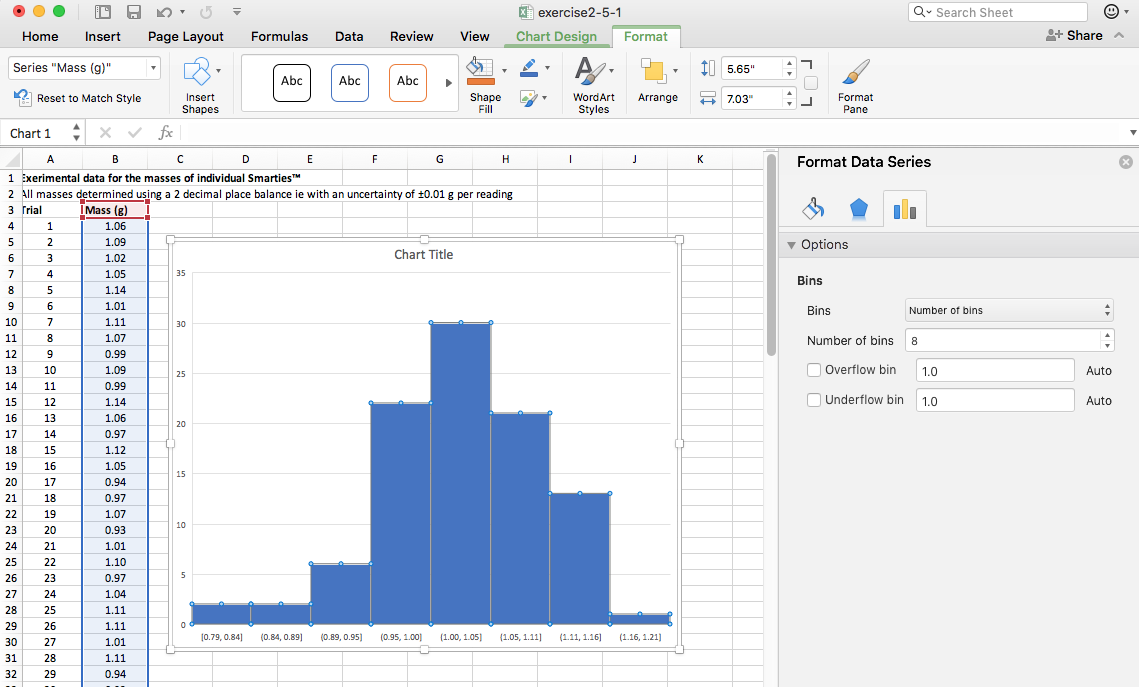
As an example, let's determine the average weight of a single sugar-coated chocolate from a box of Smarties™. The following histogram shows the distribution of experimentally determined masses for a large sample (n=97):
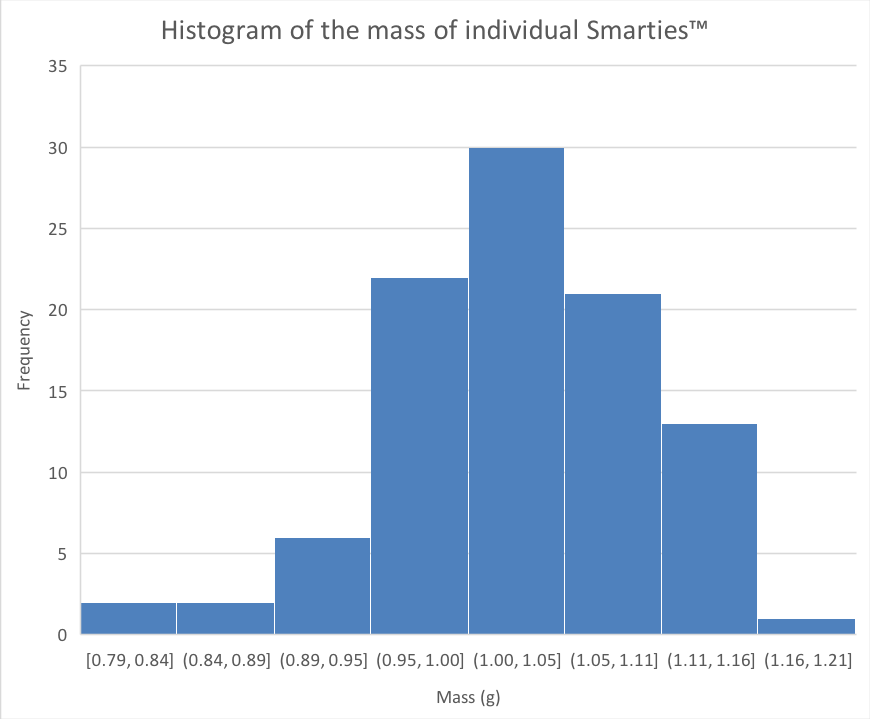
Histogram of the measured individual masses of 97 Smarties™